Four years ago, I was brought in to help a struggling SaaS company figure out why their sales team was missing quota despite what appeared to be strong performance metrics. On paper, everything looked great: they had increased lead volume by 180%, their sales reps were making more calls than ever, and their marketing team was hitting all their activity targets. The CEO was baffled – their metrics dashboard was full of green numbers, but revenue was flat and the sales team was burning out.
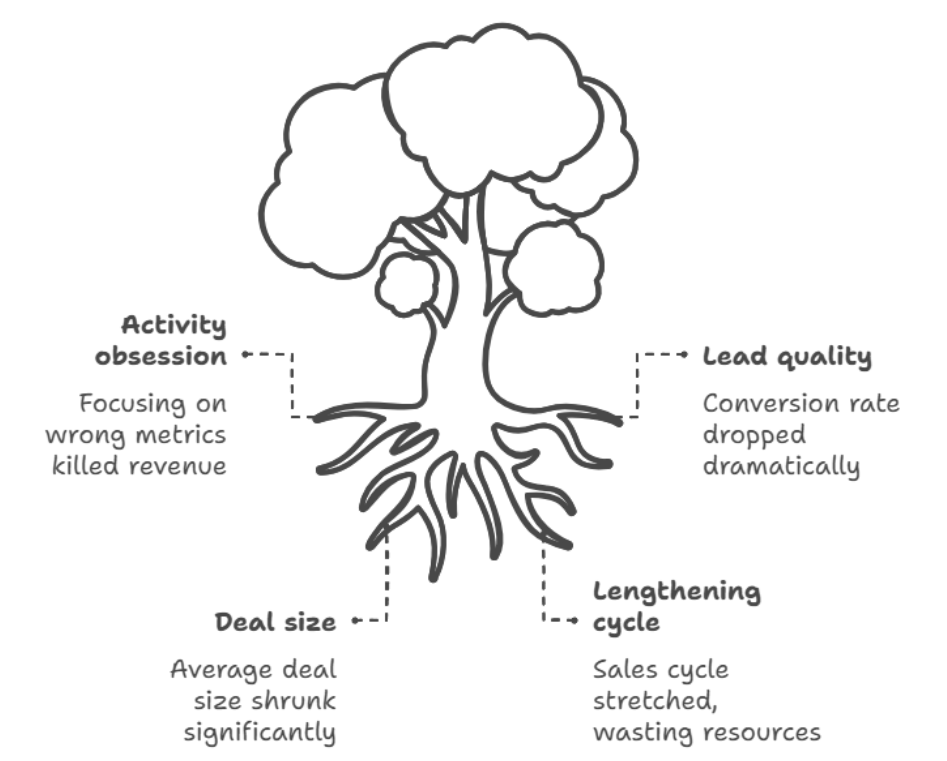
What I discovered was a perfect example of how tracking the wrong metrics can destroy a business. The company was obsessing over activity metrics – calls made, emails sent, leads generated – while completely ignoring the metrics that actually predict revenue. Their lead conversion rate had dropped from 12% to 3% over the past year, but nobody was paying attention because the absolute number of leads kept growing.
Even worse, their average deal size had shrunk by 40% as they chased quantity over quality, and their sales cycle had stretched from 6 months to 14 months because reps were spending time on prospects who were never going to buy. They were working harder than ever but moving further away from their revenue goals with each passing quarter.
The wake-up call came when we calculated that their focus on the wrong metrics had cost them approximately $2.3 million in lost revenue over 18 months. They had hired more salespeople to handle the increased “lead volume,” invested heavily in lead generation activities that produced low-quality prospects, and completely lost sight of what actually drives sustainable growth.
Why Most Sales Teams Track the Wrong Things
The biggest problem I see with sales metrics isn’t that teams don’t measure anything – it’s that they measure everything except what matters. Most sales organizations fall into the trap of tracking activities instead of outcomes, leading indicators instead of results, and vanity metrics instead of business drivers.
This happens because activity metrics are easy to measure and make everyone feel productive. It’s simple to count how many calls a sales rep makes or how many leads marketing generates. These numbers go up consistently, they’re under your direct control, and they create the illusion of progress without the pressure of actual results.
But tracking activities without connecting them to revenue outcomes is like measuring how many hours someone spends at the gym without tracking whether they’re getting healthier. You might be doing a lot of work, but you have no idea if that work is moving you toward your goals.
The revenue disconnect becomes obvious when you start asking deeper questions. A company might generate 10,000 leads per month, but if only 50 of them become customers, the lead generation process isn’t working effectively. A sales rep might make 100 calls per week, but if none of them result in qualified opportunities, those calls are just expensive noise.
I’ve seen sales teams celebrate increased “pipeline value” while their actual close rates plummet. They’re adding more opportunities to the pipeline, but those opportunities are lower quality and less likely to close. The metric looks good, but the business results get worse.
The 5 Metrics That Actually Predict Sales Success
After analyzing hundreds of sales organizations and billions of dollars in revenue data, I’ve identified five core metrics that consistently predict sales success. These aren’t the only numbers you should track, but they’re the foundation that everything else builds upon.
Pipeline Velocity is the most important metric most sales teams ignore. It measures how quickly deals move through your sales process and generate revenue. The formula is: (Number of Opportunities × Average Deal Size × Win Rate) ÷ Sales Cycle Length. This single metric combines volume, value, and efficiency in a way that directly correlates to revenue growth.
I worked with a company whose pipeline velocity had dropped 40% over six months, but they didn’t notice because they were focused on pipeline volume, which was actually increasing. The problem was that their deals were taking twice as long to close and their win rates were declining. Once we focused on improving velocity – by qualifying prospects better, shortening the decision process, and improving their sales process – their revenue increased by 65% within a year.
Lead-to-Customer Conversion Rate reveals how effectively your entire sales and marketing system works together. This isn’t just the percentage of leads that become customers – it’s the quality metric that exposes whether you’re attracting the right prospects and converting them efficiently. A high-performing B2B sales organization should see lead-to-customer conversion rates between 10-20%, depending on their industry and sales model.
I once consulted for a company with a 2% lead-to-customer conversion rate who was spending $500,000 annually on lead generation. Instead of generating more leads, we focused on improving conversion by better qualifying prospects, improving sales messaging, and tightening the handoff between marketing and sales. Within eight months, we doubled their conversion rate to 4%, which effectively doubled their ROI on marketing investment without spending another dollar on lead generation.
Customer Acquisition Cost (CAC) to Customer Lifetime Value (LTV) Ratio determines whether your sales and marketing investments are sustainable. The general rule is that LTV should be at least 3:1 compared to CAC, but high-performing companies often achieve 5:1 or better. This metric forces you to think beyond just closing deals to building a business model that generates profitable, long-term growth.
Sales Cycle Length might seem like a simple operational metric, but it’s actually a powerful indicator of sales effectiveness and market fit. Shortening your sales cycle doesn’t just improve cash flow – it usually indicates that you’re targeting better prospects, delivering more compelling value propositions, and executing more efficient sales processes. Every day you can remove from your average sales cycle multiplies your annual revenue capacity.
Win Rate for Qualified Opportunities separates sales execution from lead generation quality. This metric measures what percentage of properly qualified opportunities actually become customers. While overall conversion rates can be influenced by lead quality, win rates for qualified opportunities reveal how effectively your sales team closes deals when they have good prospects to work with. World-class B2B sales teams achieve win rates of 40-60% for qualified opportunities.
How to Calculate and Track These Metrics
Implementing effective metrics tracking requires more than just deciding what to measure – you need systems and processes that generate accurate, actionable data consistently.
Pipeline velocity calculation seems straightforward, but most companies get it wrong by using poor data. The number of opportunities should only include properly qualified prospects that have genuine potential to close. Average deal size should be based on realistic projections, not hopeful estimates. Win rate should reflect historical performance, not aspirational targets. Sales cycle length needs to be measured from first qualified contact to signed contract, not from first marketing touch to closed deal.
Lead-to-customer conversion tracking requires clarity about what constitutes a “lead” versus a “prospect” versus an “opportunity.” I recommend defining specific criteria for each stage and ensuring consistent application across your team. A lead might be someone who downloads content, a prospect might be someone who engages in sales conversation, and an opportunity might be someone with confirmed budget, authority, need, and timeline.
CAC calculation should include all sales and marketing expenses: salaries, benefits, software costs, advertising spend, event costs, and overhead allocation. Many companies underestimate their true CAC by only including direct marketing costs while ignoring sales salaries and supporting infrastructure. LTV calculation needs to account for gross margin, not just revenue, and should include realistic churn projections based on historical data.
Win rate measurement requires disciplined opportunity qualification and stage management. Opportunities should only enter your pipeline when they meet specific qualification criteria, and stage advancement should be based on buyer actions, not seller activities. An opportunity isn’t “qualified” just because a sales rep wants it to be – there should be objective evidence of budget, authority, need, and timeline.
Tools and Systems for Metric Success
The best metrics in the world are useless if you can’t track them accurately and consistently. The right tools and systems make the difference between metrics that drive decisions and metrics that collect dust.
CRM configuration is the foundation of effective metrics tracking. Your CRM should capture the data you need for your key metrics without creating excessive administrative burden for sales reps. This means custom fields for qualification criteria, automated stage progression rules, and mandatory data entry for critical information. The CRM should make it easy to do the right thing and difficult to do the wrong thing.
I always recommend implementing data validation rules that prevent common errors. For example, don’t allow opportunities to advance to “proposal” stage without a confirmed budget range. Don’t let deals sit in “negotiation” for more than 30 days without an update. These guardrails improve data quality and force better sales discipline.
Dashboard design should focus on the metrics that drive action, not the metrics that look impressive. Sales reps should see their individual pipeline velocity, conversion rates, and win rates. Sales managers should see team performance trends, pipeline health indicators, and early warning signals. Executives should see revenue predictability metrics, growth trends, and strategic performance indicators.
Real-time reporting enables faster course corrections and better decision-making. Instead of waiting for monthly reports, implement daily or weekly metric updates that allow teams to identify and address problems quickly. A deal that’s been stuck in the same stage for three weeks is much easier to save than one that’s been stagnant for three months.
Reading the Story Your Metrics Tell
Raw numbers don’t tell you what to do – you need to interpret the patterns and trends to understand what’s really happening in your sales organization.
Trend analysis reveals whether your performance is improving, declining, or stagnating over time. A single month’s metrics might be influenced by seasonality, market conditions, or random variation. But consistent trends over multiple months indicate systematic strengths or problems that require attention.
I once worked with a company whose win rates were declining gradually over 12 months – from 45% to 32% – but the decline was so gradual that nobody noticed until we analyzed the trend. Investigation revealed that a new competitor had entered the market with superior technology, and the company’s value proposition was becoming less compelling. Recognizing this trend early allowed them to adjust their positioning and product development strategy.
Segmentation analysis breaks down your metrics by different categories to identify specific areas of strength or weakness. Pipeline velocity might be strong for enterprise deals but weak for mid-market opportunities. Conversion rates might be high for referral leads but low for marketing-generated prospects. Win rates might vary significantly between different sales reps, territories, or product lines.
Common Metric Mistakes That Kill Results
Even companies that track the right metrics can fail if they don’t avoid common implementation mistakes that undermine their effectiveness.
Vanity metric addiction is the most common problem I see. Companies get excited about impressive-sounding numbers that don’t actually correlate with revenue growth. Website traffic, social media followers, email open rates, and raw lead volume all fall into this category. These metrics might be useful for specific tactical decisions, but they shouldn’t be your primary success indicators.
I worked with a marketing team that was celebrating 400% growth in “marketing qualified leads” while the actual number of closed deals was declining. The problem was that they had loosened their qualification criteria to hit volume targets, flooding the sales team with low-quality prospects. The metric looked great, but the business results were terrible.
Threshold obsession occurs when teams focus more on hitting specific metric targets than on understanding what the metrics mean. A sales rep might stuff deals into the current quarter to hit a pipeline velocity target, even though those deals aren’t really ready to close. This gaming behavior destroys the metric’s predictive value and creates bigger problems down the road.
Isolated metric tracking ignores how different metrics interact with each other. You might improve your lead conversion rate by tightening qualification criteria, but if that results in fewer total opportunities, your revenue might actually decline. Effective metrics tracking requires understanding these interdependencies and optimizing for overall business performance, not individual metric improvements.
Building a Metric-Driven Sales Culture
Successful metrics implementation requires more than just tracking numbers – you need to create a culture where data-driven decision making becomes natural and automatic.
Metric literacy training ensures that everyone understands what your key metrics mean, how they’re calculated, and why they matter. Sales reps should understand how their daily activities impact pipeline velocity. Marketing team members should see how lead quality affects overall conversion rates. Sales managers should know how to use metrics to coach effectively rather than just report performance.
Regular metric reviews should be embedded in your weekly and monthly rhythms. Monday morning team meetings should include metric updates and trend discussions. Monthly business reviews should analyze metric performance and identify improvement opportunities. Quarterly planning sessions should set metric targets and align them with revenue goals.
Accountability systems connect individual performance to key metrics without creating gaming behaviors. Sales rep compensation might include components based on pipeline velocity improvement or win rate achievement. Marketing bonuses might depend on lead-to-customer conversion rates rather than just lead volume. Management reviews should focus on metric trends and improvement initiatives.
The Future of Sales Metrics
Sales metrics are evolving rapidly as new technologies enable more sophisticated tracking and analysis capabilities.
Predictive analytics uses historical metric data to forecast future performance with increasing accuracy. Instead of just tracking what happened last month, these systems can predict which opportunities are most likely to close, which prospects are most likely to convert, and which sales behaviors are most likely to drive results.
Real-time metric updates enable immediate course corrections rather than waiting for monthly reports. Sales reps can see their pipeline velocity changing daily and adjust their activities accordingly. Sales managers can identify problems within days rather than weeks and provide more timely coaching support.
AI-powered insight generation automatically identifies patterns and anomalies in metric data that humans might miss. These systems can alert you when conversion rates decline in specific market segments, when sales cycles extend for particular product lines, or when win rates vary significantly between different sales approaches.
Cross-functional metric integration breaks down silos between sales, marketing, and customer success teams by creating shared metrics that everyone contributes to and benefits from. Customer lifetime value becomes a shared responsibility, not just a sales metric. Lead quality becomes a marketing accountability, not just a sales complaint.
Making Metrics Work for Your Team
The SaaS company I mentioned at the beginning transformed their business by focusing on the right metrics. Instead of celebrating activity increases, they optimized for pipeline velocity improvements. Instead of chasing lead volume, they focused on conversion rate optimization. Instead of adding more salespeople, they made their existing team more effective.
Within 18 months, they reduced their sales cycle from 14 months to 7 months, increased their win rate from 15% to 35%, and improved their lead-to-customer conversion rate from 3% to 8%. Most importantly, they achieved predictable, sustainable revenue growth that allowed them to scale confidently.
The key was changing their mindset from measuring activity to measuring effectiveness. They stopped asking “How many calls did we make?” and started asking “How effectively are we moving prospects through our sales process?” They stopped celebrating lead volume increases and started optimizing for revenue per lead.
This shift required discipline, especially when activity metrics declined temporarily as they focused on quality over quantity. But the revenue results spoke for themselves, and the team quickly embraced the new approach when they saw how much more effective they became.